Can Hive Genie Detect Varroa?
By Mario Chapa
You betcha!
Take a look at the three charts below. Focus on the graphs on the right side and compare them.
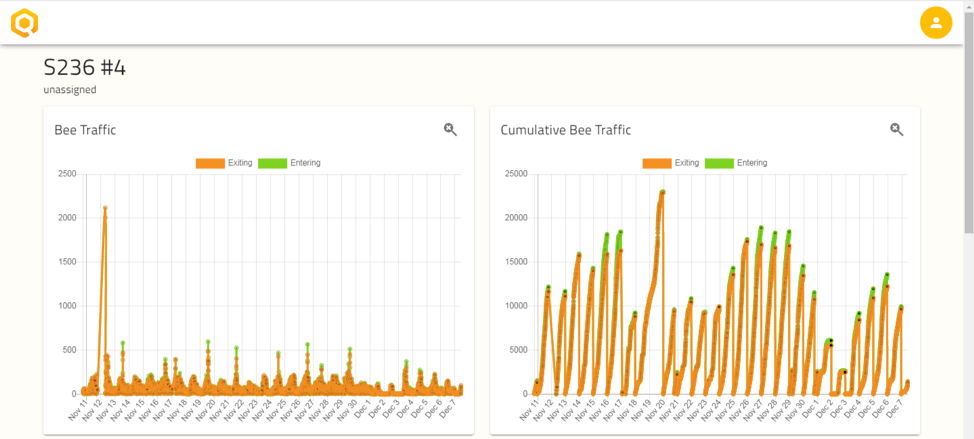
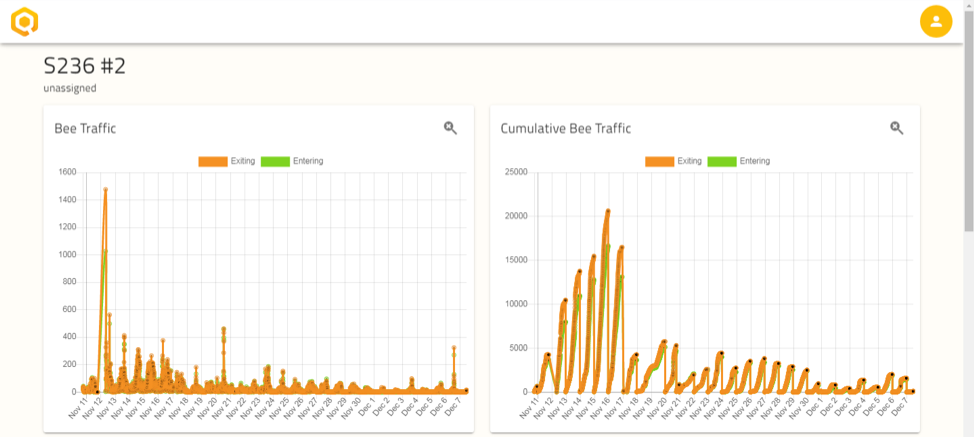
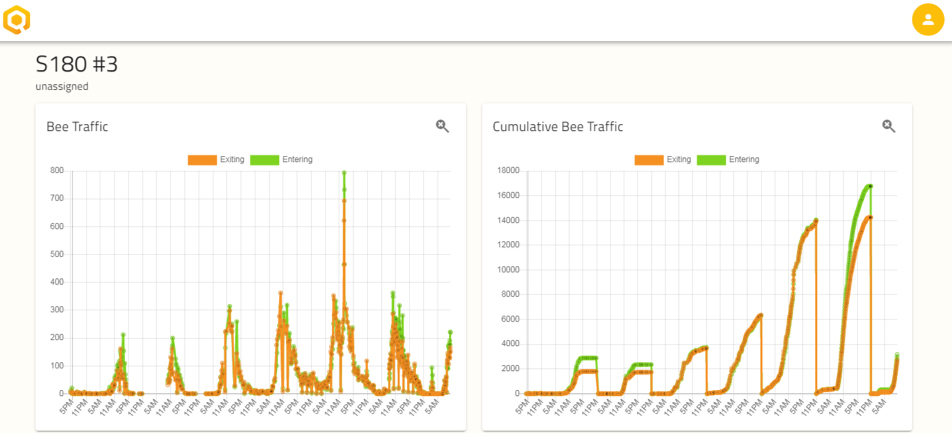
These charts are from three real hives in the same apiary at the same time frame. All of these units are monitored by Hive Genies and these charts are screenshots of the Hive Genie web app. Units 236#2 and 236#4 are actually from the same pallet. Unit 180#3 is from a different pallet in the same field. The Cumulative Bee traffic is the total bees that entered and left the hive each day. Each curve represents one day. The Bee traffic chart plots the bee traffic every five minutes. This is an apiary in south Florida in November-December of 2020, this is the height of varroa season here.
When you compare these charts it is easy to see that unit 236#4 is a consistently strong hive, usually completing anywhere from 10,000 to 18,000 trips a day save for the rainy days where traffic slows or completely stops. Unit 236#2 on the contrary, is a hive that used to be strong but has consistently dwindled down from the 10,000 to 20,000 range to below 2,000 trips a day. We can also see that during its peak days, the bees entering were consistently less than the bees leaving the hive, so it’s safe to assume that some bees are either dying outside or returning to hive 236#4, which consistently shows more bees entering than leaving. This is called drifting.
Drifting is when bees go out of one hive and come back to another one that is contiguous or really close to their original hive. Not all bees lost end in drifting. During Spring and Summer, as many as 1000 bees a day die of natural causes such as broken wings or exhaustion. Some others get disoriented or lost because of pesticides.
We have also found, after 5 years of bee monitoring, specifically counting bees entering or leaving the hive with HiveGenies, that during nice weather days and in hot summer days, many foragers prefer to sleep outside the hive. That is right, not all bees sleep inside the hive during good or hot weather. This is our discovery thanks to the Hive Genie bee counter. This is particularly interesting for commercial beekeepers that move their hives following the different blooms and make their money charging for pollination services. Monitoring returning bees and weather may serve them well to minimize losses of leftover bees. Just by timing the move out time correctly with the weather, a beekeeper can save as much as 10% of his or her bees. But, let’s go back to our hives.
When we opened these two hives for inspection and to corroborate our findings, hive 236#4 had indeed at least 8 frames of brood while hive 236#2 had only 2. Although we did not do a varroa test at the time, this was a couple of weeks before the beekeeper applied his varroa treatment, so it is safe to assume some varroa was present. Nothing else was reported as the culprit of the weak hive. I can also not pinpoint varroa as the only reason of the demise of this hive. As stated earlier, drifting played a part too. Was this drifting due exclusively to distracted bees? Or do bees sensing and smelling the decaying hive due to varroa just rather drift to a healthier smelling hive? Or does the activity in the strong hive inherently attract bees? Hard to say, but the answer may very well be yes to all of the above. Whether varroa, lack of food, drifting, or any other disease caused hive 236#2 to decay is irrelevant. The relevant issue is that Hive Genie was able to detect this issue the same day it happened and alerted the beekeeper in time for him or her to save the hive. Adding a queen or a frame of brood or whatever the solution was. By alerting the beekeeper in time, we can tell a success story rather than the all too typical “I don’t know what happened, I opened the hive and they were all dead…” Most beekeeping issues that kill a hive can be prevented if the beekeeper is alerted on time. This is the value of Hive Genie. It is far better to spend money in a queen or time exchanging a frame of brood, than losing a hive late in the season and lose the revenue of next year’s pollination. Or worse yet, transport this hive all the way to California, only to find out it is dead. In this particular case, the beekeeper was not prepared to act, so he never re-queened, he was just confirming if Hive Genie was capable of accurately predicting hive strength and health, which is exactly why the traffic curve never improved or has not improved yet, as we are told they will act soon.
Now take a look at hive 180#3. This hive is a great example of a hive in growth mode. This is also after varroa treatment, but we don’t have the specific varroa count before and after treatment. Nevertheless, it is safe to assume that varroa numbers were lower after the treatment than before the treatment. Still, it is also not entirely correct to assume that the growth spur is only due to diminishing varroa numbers just a week or two after treatment since the egg to bee cycle takes 21 days. What is safe to assume is that whatever the reason, this hive is doing better in terms of trips, and therefore it is safe to assume this hive is healthy. Which for a beekeeper, that’s all that matters.
There is a minimum number of bees required for housekeeping shores, that is why stronger hives have many more bees devoted to foraging. A strong hive can produce four times the honey than a weak hive. So, bee traffic is a great indicator of the strength of a hive, it is also a good indicator of honey production and pollination activity. A simple algorithm can easily predict when to add a super for more honey. Over the years, and after monitoring hundreds of hives with different sensors that measure weight, temperature, relative humidity, light intensity, Carbon Dioxide and bee traffic, I’ve come to realize that bee traffic is by far the best and possibly the only measure needed to effectively monitor a beehive’s strength and health. The Hive Genie bee counter effectively eliminates the need to open a hive just to count how many frames of bees are there or to see if they are healthy. The cumulative bee trips are a great proxy of the strength and health of a hive.
In the not so distant future, all beekeeping will be done using beehive monitors such as HiveGenie. It just makes no sense to do it any other way anymore. The speed and cost at which hives can be classified and inspected with HiveGenie is nothing compared to the cost of a beekeeper opening a hive just to inspect it. I wouldn’t be surprised if pollination customers are the ones who start paying and classifying beehives based on bee trips. Ultimately it is bee trips they are after to ensure pollination and what better way to select a strong beehive than actually counting bee trips? Mark my words, beehive monitoring is here to stay.